

Three systems, three versions of the revenue number
Your CRM records what was sold. Billing records what was invoiced. The ERP records what was recognized and collected. Each one is accurate to itself, and none of them agree at the customer level. Finance rebuilds the bridge in Excel before every board meeting, and the follow-up questions still can't be answered in the room.
What that looks like in practice:
Revenue by customer differs between CRM, billing and the ERP
New, lost and expanded customer counts are calculated differently by different teams
Segment cuts by product, cohort, entity, or region require a manual rebuild every time
After an acquisition, two or more systems report the same customers in different ways
Auditors and buyers ask for customer-level support the team has to assemble from scratch
Chassi reconciles every customer from opportunity to cash, so every revenue number finance reports ties to the contract, the invoice, and the payment

How it works
Connect the systems, reconcile every customer, then report from one source.
Connect your systems of record
Read-only connections to CRMs, ERPs, billing systems, data warehouses, and contract data. No system changes.
Reconcile every customer, line by line
Chassi matches contracts to bookings, bookings to billing, and billing to recognized revenue and cash. Every variance is classified by cause: accounting errors, system errors, change-order timing, FX and adjustments, price increases and small variances.
Report from one source
Segment revenue and customer movement by product, cohort, entity, or region, using ARR metrics for SaaS or contracted-revenue metrics for every other model. The Cube stays current through the hold period, so each reporting cycle starts from reconciled data.
First material findings in 3–4 weeks. Fully operational Customer Cube by week 6.
What lands on your desk
A customer-level reconciliation of booked, billed, recognized, and collected
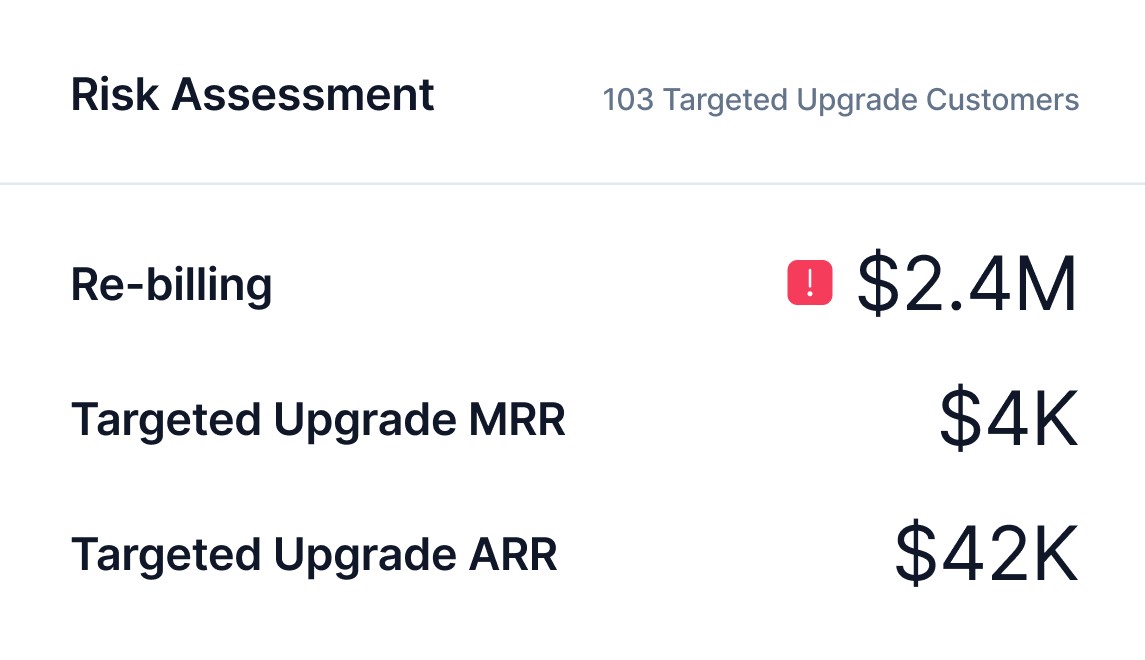
Variances classified by root cause, with the dollar value of each
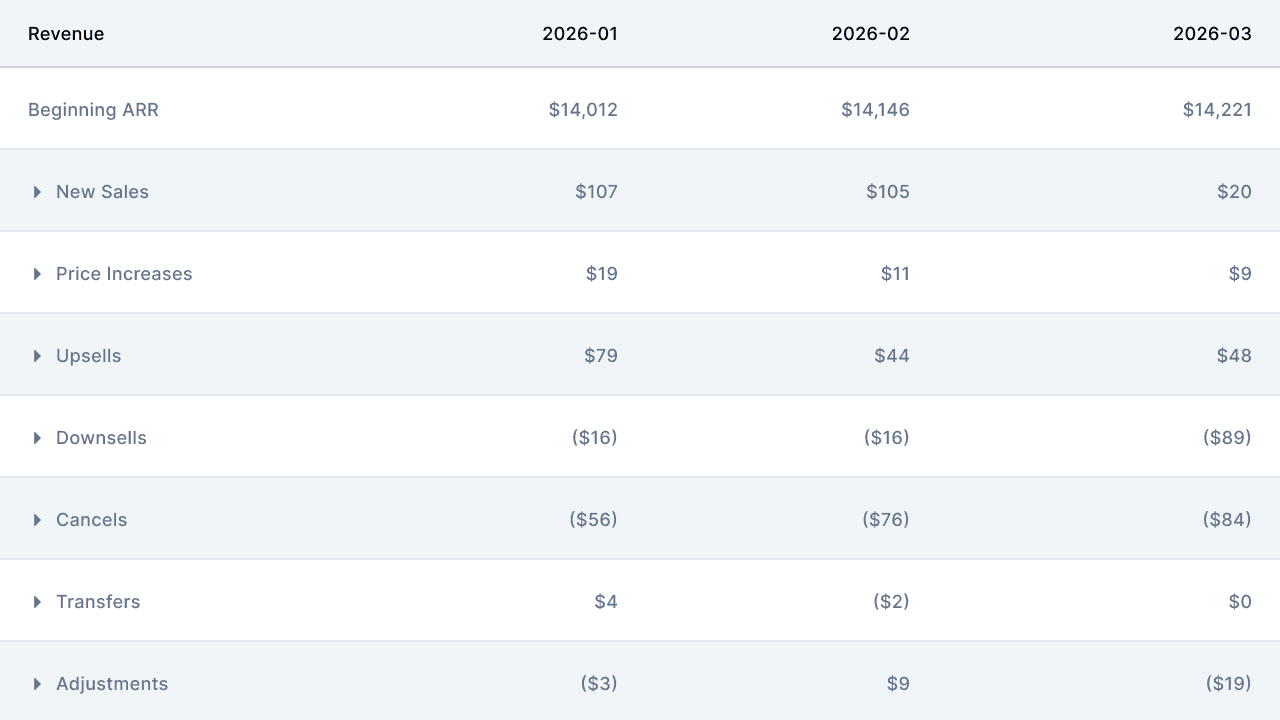
Revenue movement by customer: new, expansion, contraction, and lost
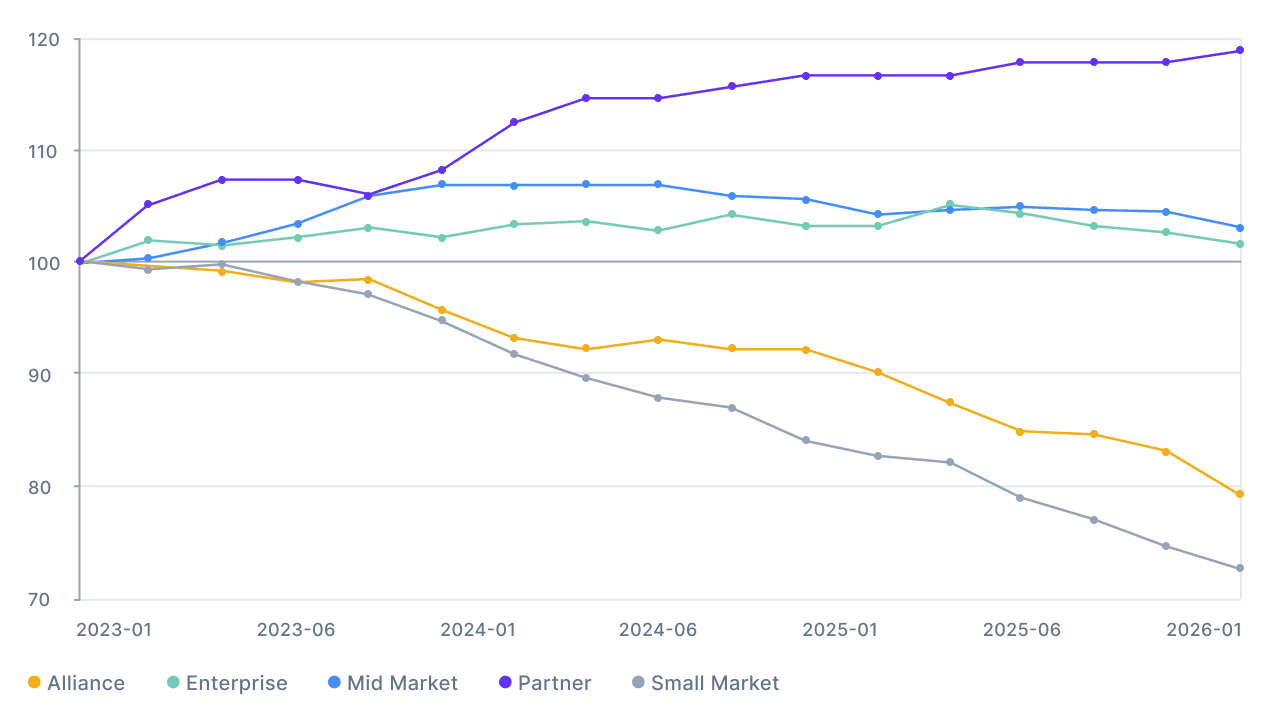
Segment views by product, cohort, business unit, entity, or region
Exception tables and a data fix list for the source systems
What your team can do with it
Hand the board, auditors, and buyers customer-level support for every revenue number, on request
Fix each variance at its source, starting with the largest dollar impact
Explain revenue movement in the board meeting and answer follow-up questions in the room
See which segments retain and grow, and which ones contract, from one data set each cycle
Give each system owner a specific fix list, so the same errors stop recurring
One Cube, reported in the language your business runs on
The reconciliation underneath is identical for every business model. What changes is the nomenclature and the KPIs the Cube tracks, month over month, for every customer.
SaaS
Contracted and Recurring Revenue
Revenue base
ARR and MRR
Contracted revenue, recurring service revenue, and backlog
Revenue movement
New, upsell, downsell and churn
New customers, expansions, price escalators, price reductions, and lost customers
Retention KPIs
NRR, GRR and logo churn
Revenue retention, customer retention, and renewal rate
Pricing events
Uplifts, co-terms and renewals
Price escalators, change orders, and renewal terms
Units tracked
Seats, licenses and usage
Sites, locations, service agreements, and units
Board view
ARR snowball
Revenue bridge
Every KPI on either side is calculated from the same reconciled customer data, so the figure in the board deck ties to the contract, the invoice, and the payment.
Real-world impact
A PE-backed company preparing for exit used the Customer Cube to reconcile reported revenue to billing and cash.
Chassi found a $5M net revenue overstatement and traced it to its causes before the exit process began.

We already report revenue from our BI tool or FP&A model. What does the Cube add?
BI tools and FP&A models report whatever the source systems hand them. When CRM, billing and the ERP disagree, someone on the finance team resolves it by hand each cycle. The Cube resolves those differences at the customer level first, so every report starts from a number that ties out.
Our revenue is straightforward. Do we need customer-level reconciliation?
If the board has ever asked a question that required rebuilding the analysis, or if an acquisition added a second billing system, the detail matters. The Cube is also what the Revenue Forecast, Revenue & Cash Leakage and Working Capital Intelligence solutions run on.
We just went through an acquisition. Can the Cube handle multiple systems?
Yes. Multiple ERPs, CRMs and billing platforms are the situation the Cube was built for.
Does this replace our FP&A model or board reporting?
No. It gives FP&A a reconciled foundation to build from, so the team spends its time on analysis and narrative.
Our data is messy. Do we need to clean it up first?
No. Exception tables and a data fix list are part of the deliverable.
How long until we see results?
First material findings in 3–4 weeks. Fully operational Customer Cube by week 6.
Can your team trace every revenue number to the customer and the contract?
See what the Customer Cube finds in your data.