
Pathways & Processes User Guide
Your guide to navigating Milestones, Pathways, and Cycle Times (Process Pulse + Point-to-Point).
1. Milestones
Add suggested milestones based on your tracked records.
Import from Catalog suggests milestones based on your tracked records, including name, record type, event type, and occurrences, removing the need for manual searching and supporting comprehensive process analysis.
Milestone configuration is a requirement for the Cycle Times and Pathways modules. Ensuring your milestones are properly configured before using either module is essential.
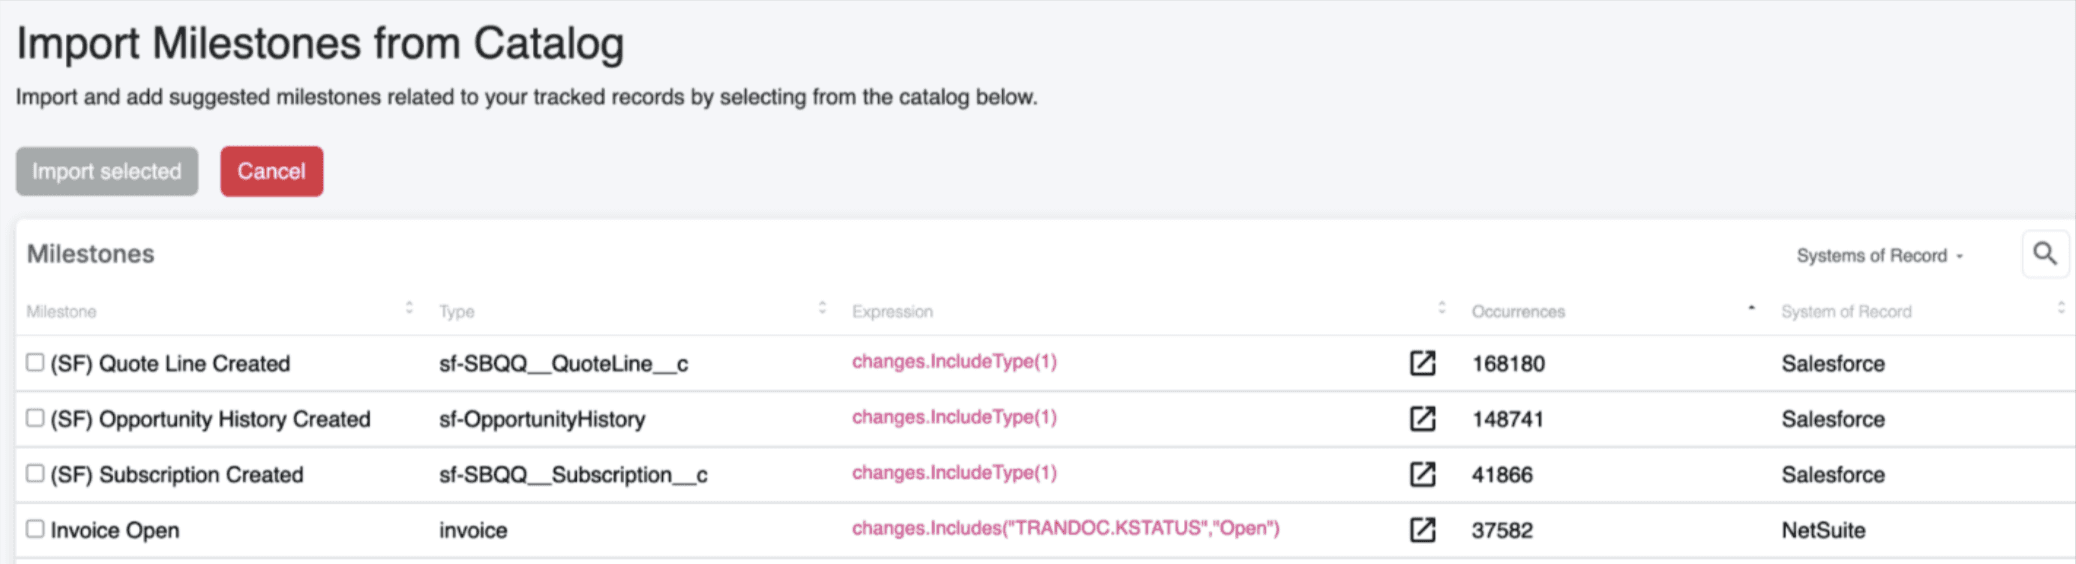
How to import milestones
1. Open Milestones From the sidebar, click Configuration to expand the blade, then select Milestones (second tab). |
2. Click Import from Catalog This opens the list of suggested milestones associated with your tracked records. |
3. Select and import Choose the milestones relevant to your analysis and click Import Selected. Confirm the prompt to proceed. |
4. Milestones are staged Selected milestones will appear with the status Staged for Processing. |
5. Process the milestones Click Process Events, then select Update Pathways from the dropdown. This begins processing events and includes the selected milestones in your pathway analysis. |
Milestones must be processed to appear in pathways. If you skip the Process Events step, they will remain staged and will not be included in your pathway analysis.
2. Pathways
End-to-end visual mapping of how work actually flows through your processes.
Pathways show how work actually flows through your system, not how it was designed to flow. It traces each milestone and variation across records, giving you an objective end-to-end view of real process behavior.
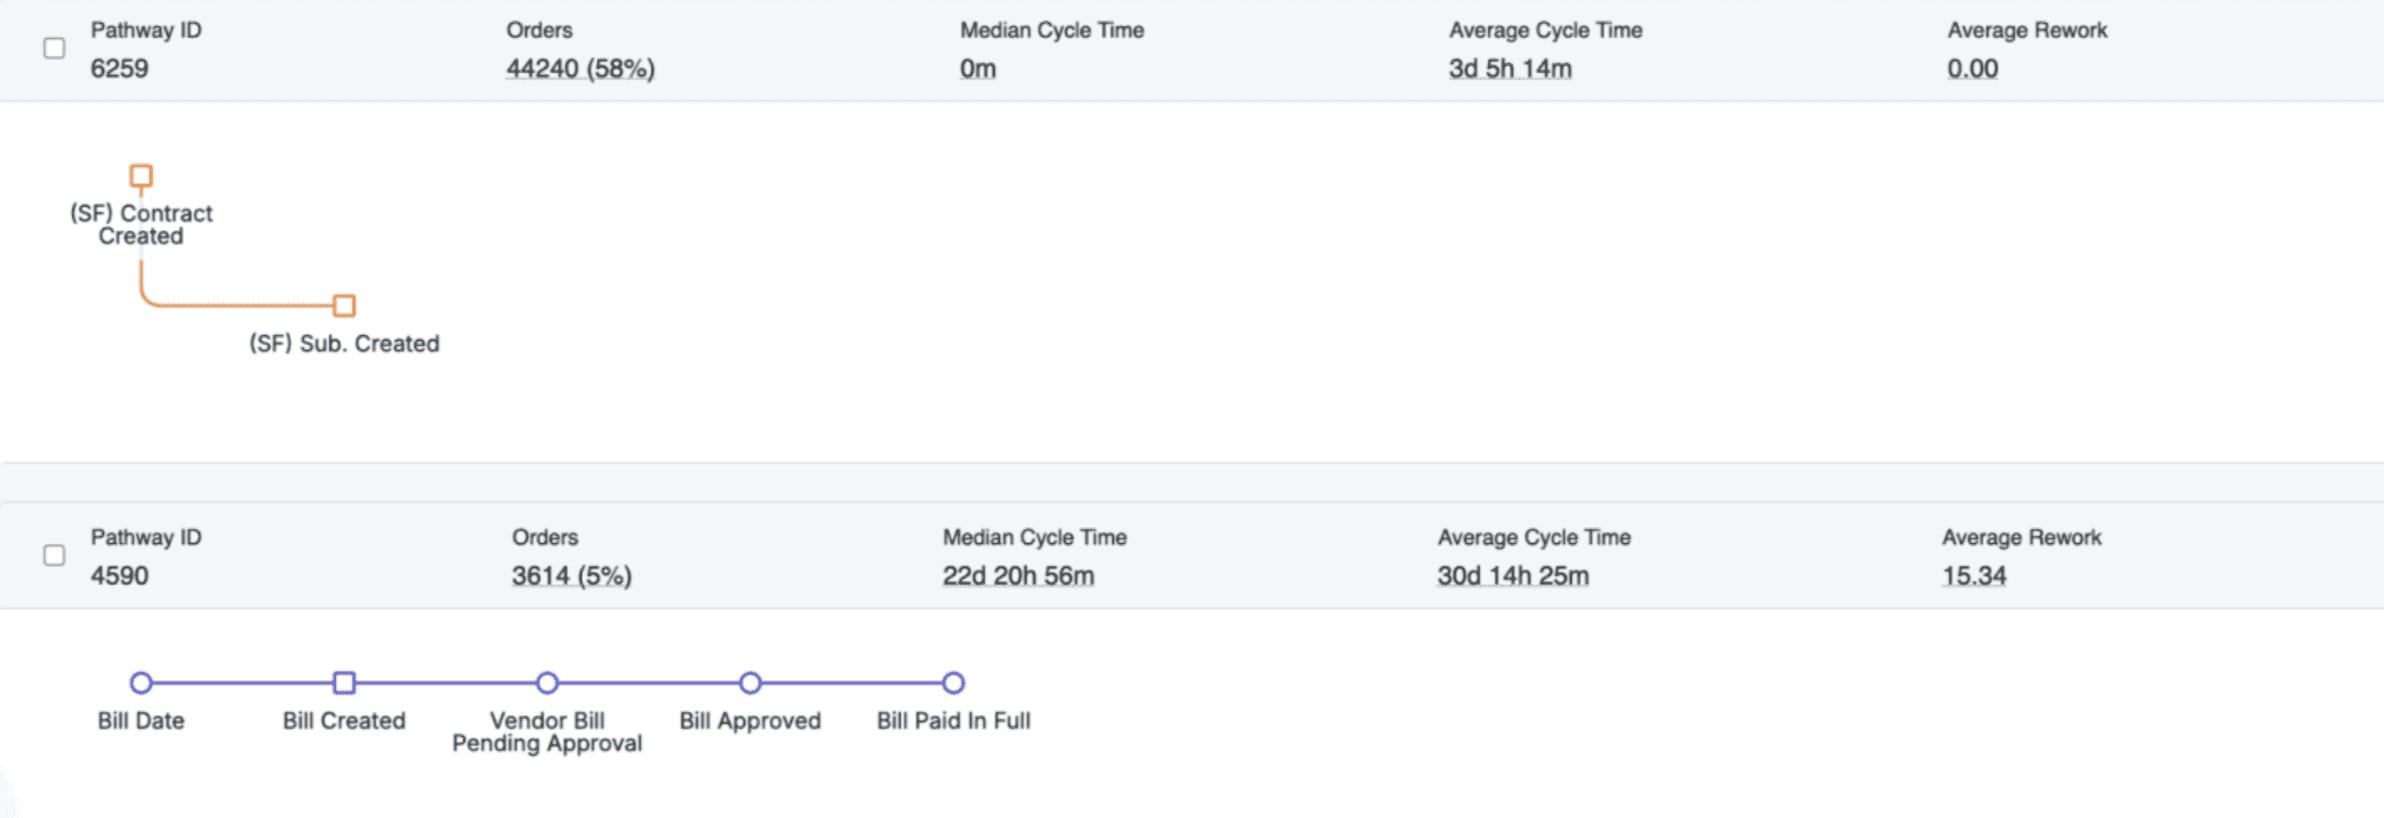
How to use it
1. Navigate to Pathways Select the Pathways module from the sidebar. Pathways are displayed by default from most to least orders. |
2. Click Filter Pathways Expand the Pathway Criteria panel to view all available filters. |
3. Apply Basic Filters (optional) Includes Milestone, Excludes Milestone, Employee, Pathway ID, Customer, Subsidiary, or Time Frame. 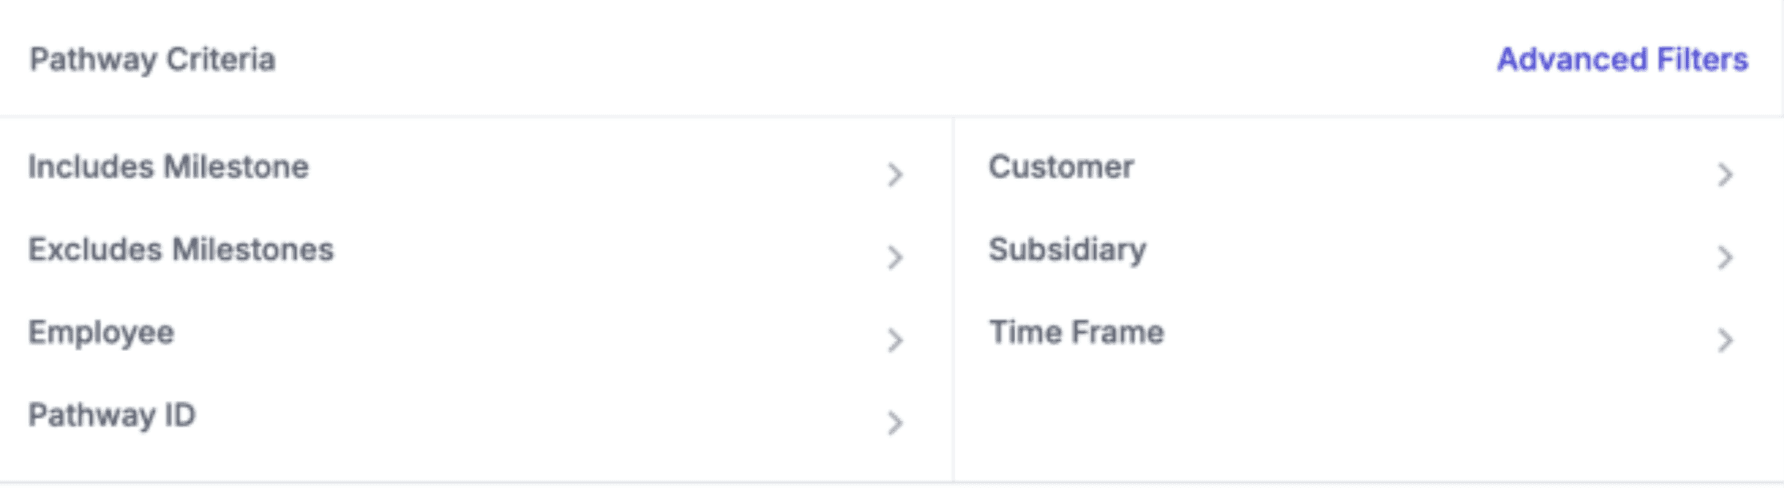 |
4. Apply Advanced Filters (optional) Apply additional filter conditions to refine your results further. 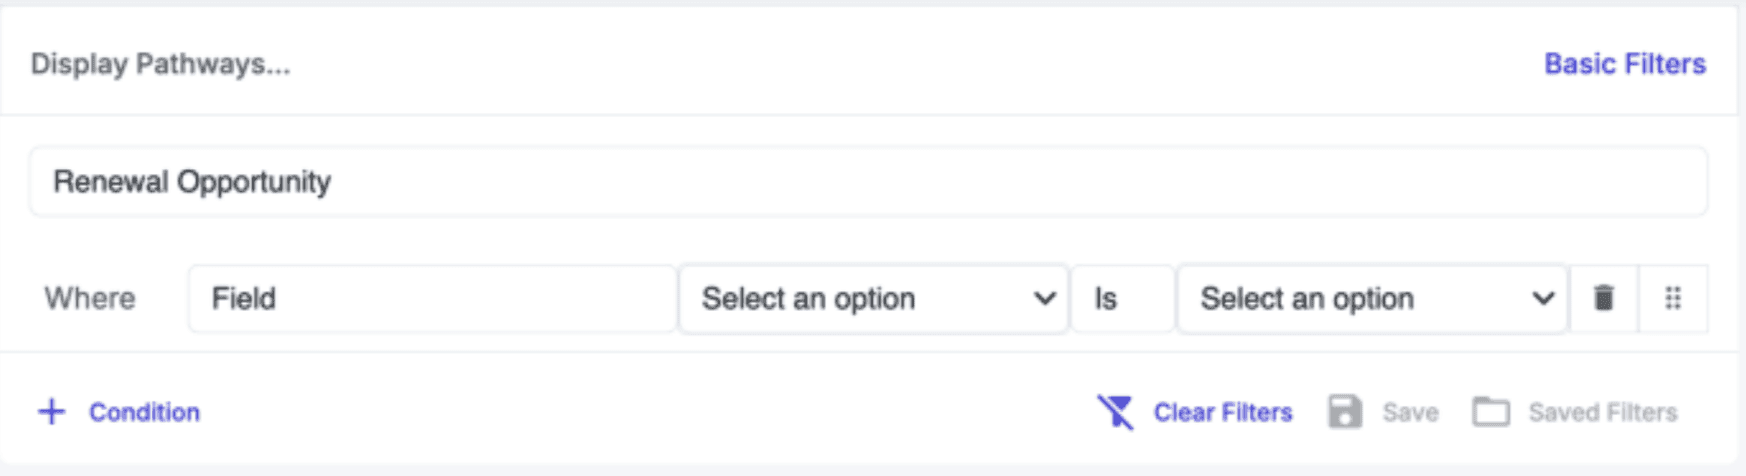 |
5. Click Update Saves your filters and renders the updated results. |
Understanding metrics
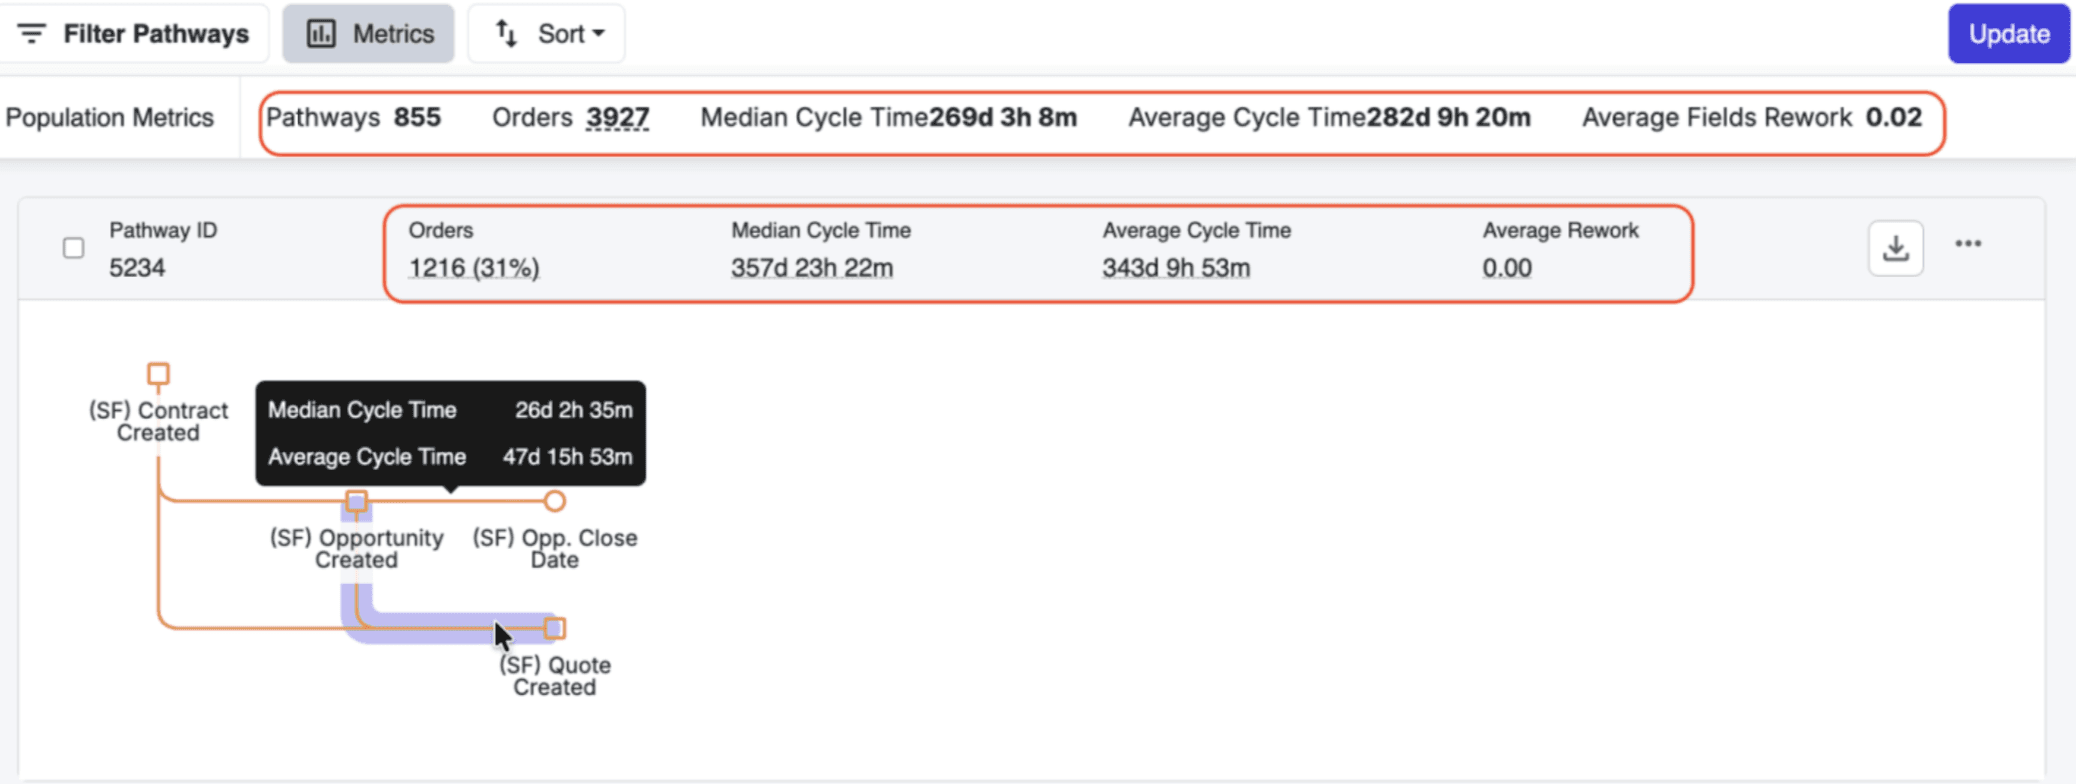
Metric | What it means |
|---|---|
Population Metrics | A high-level summary across all pathways returned based on your filters. Descriptions for each metric are below: |
↳ Pathways | Number of unique pathways returned based on your filters. |
↳ Orders | Number of unique orders following each pathway. |
↳ Median Cycle Time | The middle value of cycle time across all pathways. |
↳ Average Cycle Time | The mean cycle time across all pathways. |
↳ Avg Rework (Field) | Average number of times a field was reworked across all pathways. |
Individual Pathway Metrics | Metrics for a single pathway, aggregated across all its orders. Click any metric to drill down for more details, such as the full order list. |
Pathway Milestone Segments | Hover over any milestone segment to see its cycle times. |
3. Cycle Times: Process Pulse
Aggregate view across multiple pathways.
Process Pulse lets you combine multiple similar pathways into a single, high-level view of a process, making it easy to spot bottlenecks, delays, and performance trends without reviewing each pathway individually.

How to use it
1. Navigate to Process Pulse Navigate to the Cycle Times module to access Process Pulse. |
2. Click + Create Your First Process Measurement |
3. Enter a title Use a descriptive name that reflects the process (e.g., Lead to Cash). |
4. Select milestones Choose between 2 and 11 milestones that reflect the actual sequence in your data (e.g., Opportunity Created → Sales Order Created → Invoice Created). I Milestone order matters. The sequence must reflect how events actually occur in your data, not just how they appear in the system. |
5. Apply filters (optional) Refine the population using Includes, Excludes, Employees, Customers, Subsidiary, and Time Frame filters. |
6. Define the time frame Set a date range. The measurement will start at your first milestone and end at your last. |
7. Review and save Review the Population Metrics summary, then click Save to generate the aggregated snapshot. |
Understanding the metrics

Metric | What it means |
|---|---|
Pathways | Number of distinct workflows matching your selected criteria. Drilling into this metric displays all unique pathways. |
Orders | Total volume of orders within the selected population. Drilling into this metric displays all associated orders. |
Select any of the following metrics to open its detailed view, where you can explore the data using a Scatter Plot, Histogram, or a Detailed Order Table. | |
Med Cycle Time | Median time between the first and last milestone, reflects typical process duration. |
Avg Rework | Average number of times steps were repeated or modified per order, surfacing potential inefficiencies. |
Segmentations | Click any pathway segment to expand median and average cycle times between two milestones for deeper analysis. |
4. Cycle Times: Point-to-Point
Cycle time analysis between two specific milestones
Point-to-Point measures the time it takes for a process to move between two defined milestones, helping you find opportunities for improvement within a targeted segment of your workflow.

How to use it
1. Navigate to Point-to-Point Navigate to the Cycle Times module to access Point-to-Point |
2. Click + Point-to-Point to create a new measurement |
3. Enter a title Use a name that clearly describes the segment (e.g., Invoice Created to Paid). |
4. Select From and To milestones Choose the starting and ending milestone for the segment you want to measure. |
5. Apply filters (optional) Narrow results by Includes, Excludes, Employees, Customers, Subsidiary, or Time Frame. |
6. Define the time frame The date range starts at the From milestone and ends at the To milestone. |
7. Set a Goal (optional) Define a target cycle time to benchmark performance and track efficiency improvements. |
8. Set an Exception (optional) Specify a cycle time threshold. Records that exceed it will be flagged in the exception report. |
9. Review and save Review the Population Metrics summary, then click Save. |
Understanding metrics

Metric | What it means |
|---|---|
Median | The median time to complete the selected segment across all applicable records. |
Average | The mean time taken to complete the selected segment. |
Goal | Your target cycle time for this segment, used as a benchmark to track progress. |
Exceptions | Records where the cycle time exceeded your defined threshold, flagged for follow-up. |
CTA Time Frame | The date range in which the Point-to-Point measurement occurred. |
CTA Count | Total number of CTA instances for the selected Point-to-Point (interval between two milestones). Some orders may include multiple instances. |
Select any metric to open a detailed view, offering three ways to interact with the data: | |
Scatter Plot | Visualize individual cycle times, useful for spotting trends and outliers. |
Histogram | Understand how cycle times are distributed and how frequently each range occurs. |
Detailed Table | Lists orders with customer details, timestamps, and Point-to-Point cycle time; some orders may have multiple CTA instances. |
Need help? Contact your Chassi point of contact or email support@chassi.com